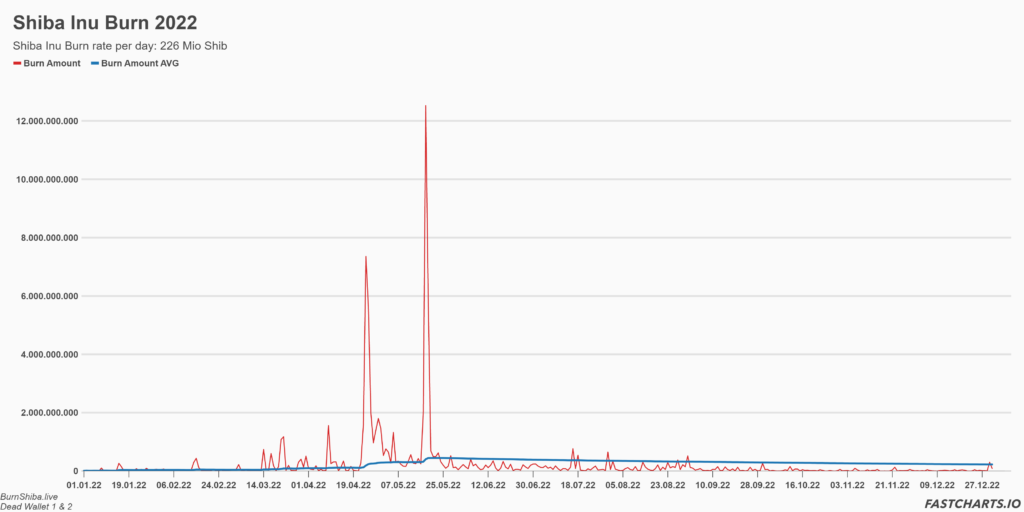
As we enter the new year, it’s worth taking a look back at the Shiba Inu token burns that took place in 2022. In total, 82,781,304,637 Shib tokens were burned, which represents 0,015% of the circulating supply.
Shytoshi declared 2022 as the year of #burns, and it’s clear that he wasn’t wrong.
The day with the most burns occurred on May 18th, 2022, with a total of
12,524,505,901 Shib tokens burned in a single day. These burns saw a
sharp increase following the announcement of the Burn Portal on April
23rd as shown in the accompanying graphs.
This surge in burns pushed the
Shiba Inu Burn Visualizer to its limits, causing crashes and frame
drops during its display. However, the largest burn of 100,000,000,000
Shib tokens was still captured as an NFT Burn.
Moving forward, the Shiba Inu Burn Visualizer will display the burn rate for the entire current year.
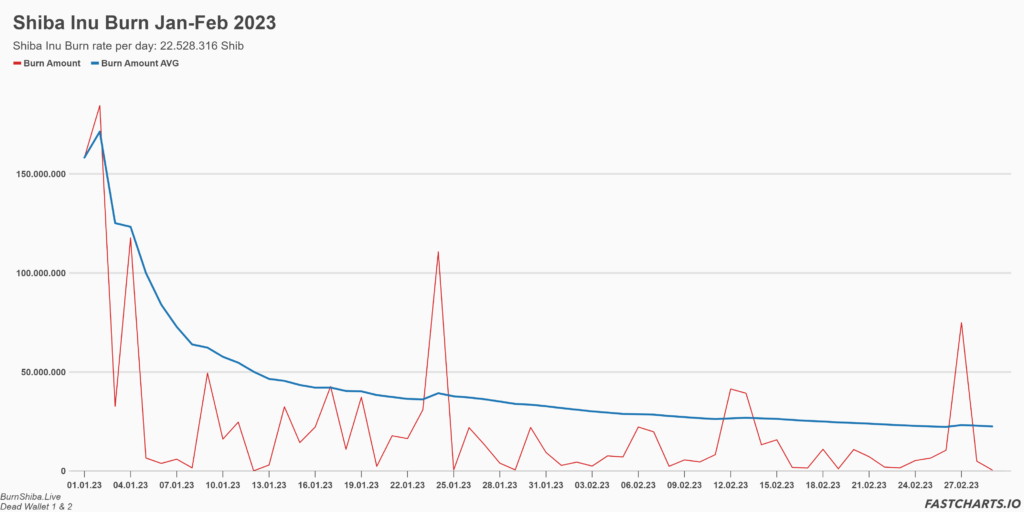
For 2022, the burn rate averaged 226 million Shib Inu tokens per day. For 2023 the burn rate calculation period january to february has dropped to 22 million Shib Inu tokens.
It’s worth noting that the circulating supply was used from CoinMarketCap, and DeadWallet1 and DeadWallet2 were used for the burn data. Overall, the 2022 burns were a significant event for Shiba Inu, and it will be interesting to see what the future holds with Shibarium and the integrated burning mechanism for transactions on this Layer2.
Ultimately, we will have to wait until the end of 2023 to determine if the burn rate from 2022 will be matched or exceeded. Additionally, the graph below displays the trend of token burns up until the end of February 2023.


